How to use water heater diagrams:
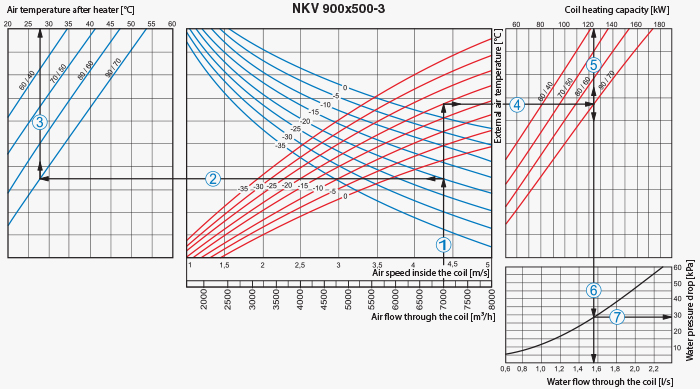
Air Speed. Starting from 7000 m3/h on the air flow scale draw a vertical line 1 till the air speed axis. It makes 4.4 m/s.
-
Supply air temperature. Prolong the line 1 up to the point where it crosses the outside air temperature (blue curve), e.g. -20°C; then draw a horizontal line 2 from this point to the left till crossing water in/out temperature curve (90/70 °C). From this point draw a vertical line 3 to the supply air temperature axis on top of the graphic (+28°С).
-
Heating coil capacity. Prolong the line 1 up to the point where it crosses the outside air temperature indicated as red curve (e.g., -20°С) and draw a horizontal line 4 from this point to the right to the intersection of water in/out temperature curve (e.g., 90/70 °С). From this point draw a vertical line 5 up to the scale of heating coil capacity (124.0 kW).
-
Water discharge. Prolong the line 5 down to water discharge axis at the bottom of the graphic 6 (1.55 l/s).
-
Water pressure drop. Draw the line 7 from the point where line 6 crosses the black curve to the pressure drop axis (28.0 kPa).