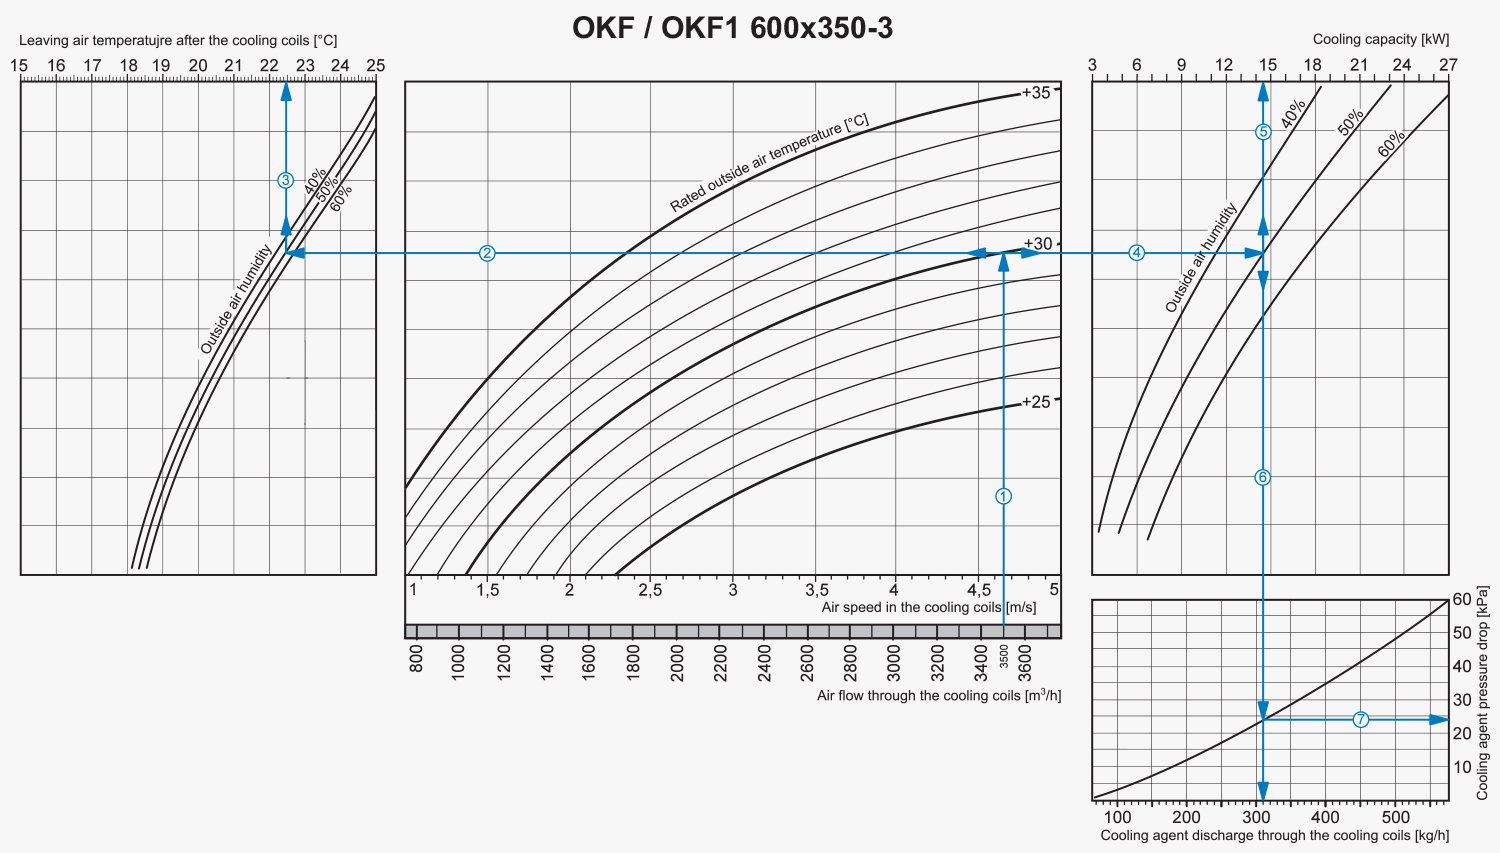
How to use freon cooler diagrams:
Air Speed. Starting from 3500 m3/h on the air flow scale draw a vertical line 1 till the air speed axis. It makes 4.65 m/s.
-
Supply air temperature. Prolong the line 1 up to the point where it crosses the outside air temperature (e.g. +30°C); then draw a horizontal line 2 from this point to the left till crossing the outside air humidity (e.g. 50%). From this point draw a vertical line 3 to the supply air temperature at cooler outlet axis on top of the graphic (+22.5°C).
-
Cooling coil capacity. Prolong the line 1 up to the point where it crosses the outside air temperature (e.g. +30°C) and draw a horizontal line 4 from this point to the right until it crosses the outside air humidity curve (e.g., 50%), from here draw a vertical line 5 up to the scale representing the cooling capacity (14.5 kW).
-
Cooling agent discharge. Prolong the line 5 down to cooling agent discharge axis at the bottom of the graphic 6 (310 kg/hour).
-
Cooling agent pressure drop. Draw the line 7 from the point where the line 6 crosses the black curve to the pressure drop axis. (24.0 kPa).